| Previous Top Next |
Windows Time Auditor
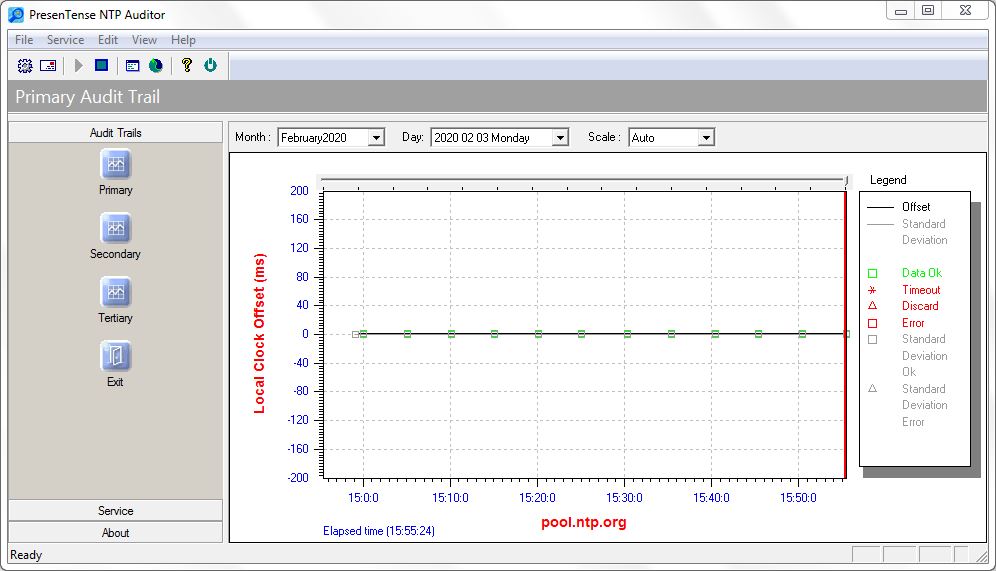
Audit TrailsPresenTense NTP Auditor supports the generation of primary, secondary and tertiary audit trails, charting local system time with respect to legal sources of UTC and automatically archives logs according year and month. The display will automatically show the most recent day for which a log was created. See screenshot below.
Offset Graph : The offset graph displays the difference between local system time and the primary, secondary, or tertiary legal source of Coordinated Universal Time. Each data point represents the average of the measurements collected at the sample interval and is marked as follows :
1. A green square denotes a valid sample set. A statistical filter has been applied to discard measurement errors resulting from network jitter and the arithmetic mean of valid measurements has been computed to represent the local system time offset to the legal source of Coordinated Universal Time.
2. A red star or "x" denotes that the connection to the server has timed out at the marked sample interval and the last known time offset is charted by default.
3. If the measured offset exceeds the currently selected scale, the offset is marked as a red triangle at the top or bottom of the chart.
4. If the measured offset has been discarded due to excessively high standard deviation in the sample set, the offset is marked as a red triangle. See Standard Deviation Statistical Filter.
Standard Deviation Graph : The standard deviation graph shows the standard deviation of the sample set recorded at each sample interval.
Scale : The default scale auto-adjusts to display the most recently recorded offset.
